Checked against the textbook
Measured against Murphy’s Technical Analysis of the Financial Markets.
We scanned the full text of John J. Murphy’s 596-page standard reference for every named indicator and chart construction, then set the list against the Art’s Charts study registry. Mention counts are our own measurements of how often each term appears, including the index and captions, so they show emphasis rather than exact usage. Figure counts are distinct figure labels: 235 across 18 chapters.
14 of 17named indicators in today’s 33-study catalog
7need a data feed no price bar carries
1held until a verifiable reference exists
6drawing tools for the book’s price structures
Indicators the book names
| Murphy’s term | Mentions | Art’s Charts study | Status |
|---|
| Moving averages (simple, exponential, weighted) | 259 | SMA EMA WMA | In catalog |
| Relative strength index | 144 | RSI | In catalog |
| Parabolic SAR | 104 | SAR | In catalog |
| MACD, with histogram | 104 | MACD | In catalog |
| Commodity channel index | 99 | CCI | In catalog |
| Rate of change | 95 | ROC | In catalog |
| On balance volume | 75 | OBV | In catalog |
| Stochastic (%K / %D) | 73 | STOCH | In catalog |
| Momentum | 69 | — | Not in v12 catalog |
| Directional movement (ADX, ±DI) | 49 | ADX | In catalog |
| Envelopes / trading bands | 41 | — | Not in v12 catalog |
| Bollinger Bands | 21 | BBANDS %B BandWidth | In catalog |
| Accumulation / distribution | 18 | — | Not in v12 catalog |
| Williams %R | 10 | WILLR | In catalog |
| Standard deviation | 9 | STDDEV | In catalog |
| Average true range | 8 | ATR | In catalog |
| Money flow index | 4 | MFI | In catalog |
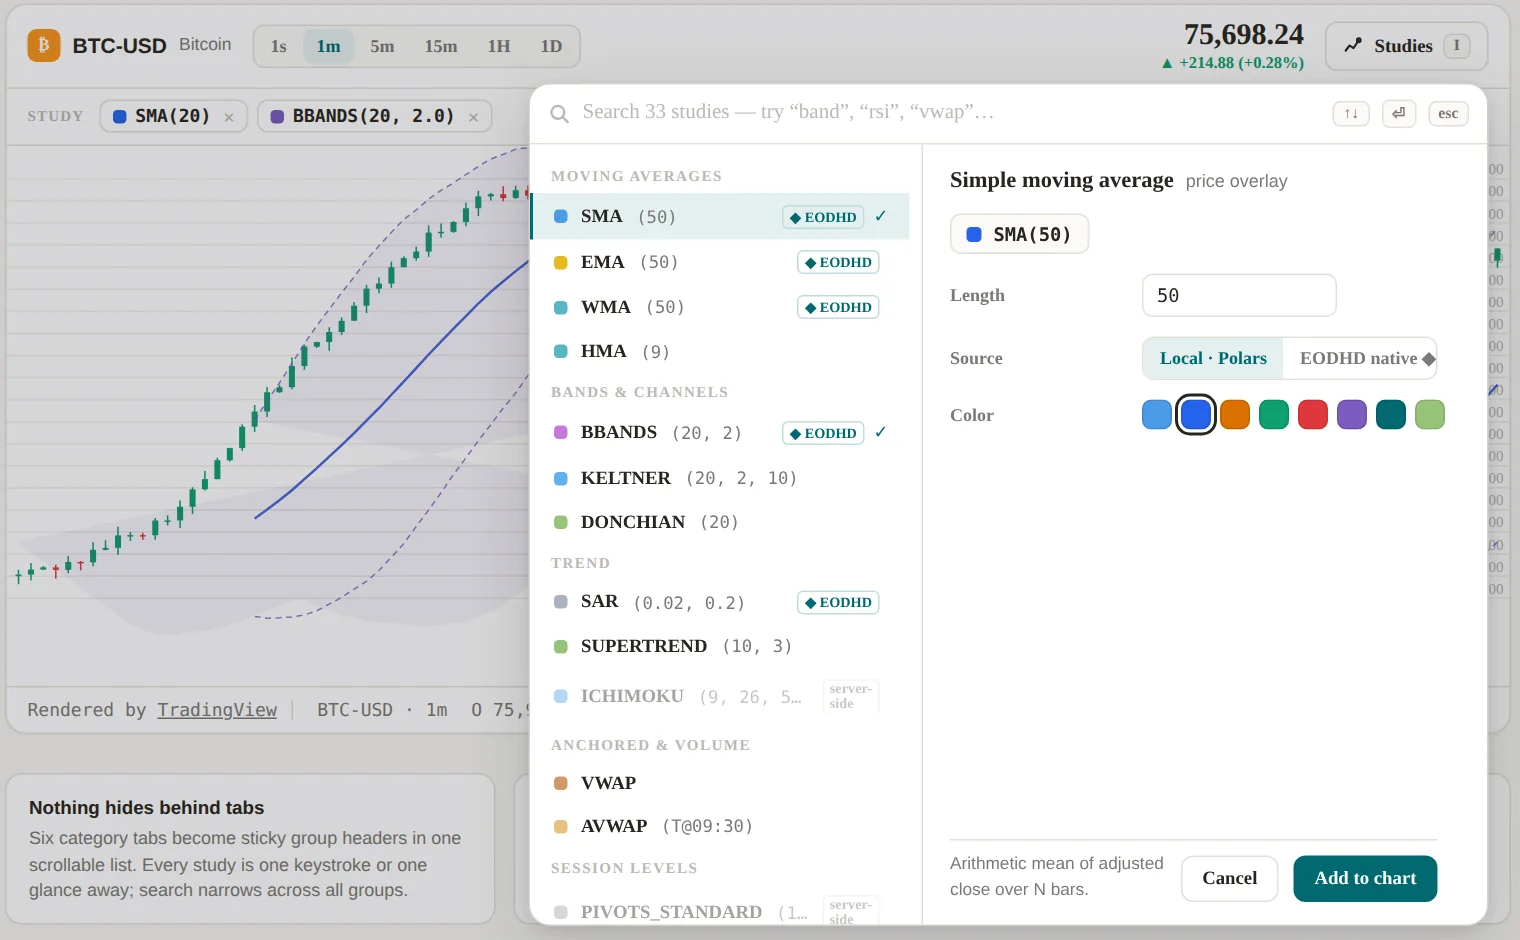
Momentum, envelopes and accumulation/distribution were in the registry when the scan was made but are not in the v12.0.0 catalog; Keltner and Donchian channels and Chaikin Money Flow cover nearby ground. The catalog also carries studies beyond these 17 names, among them VWAP, anchored VWAP, StochRSI, Hull MA, Supertrend, Ichimoku, pivot points, TRIX, Awesome Oscillator, Ultimate Oscillator, Vortex and Choppiness. Parameter help in the study palette draws on the book’s guidance, for example shortening RSI to 7–9 days for wider swings.
Not a calculation problem: needs other data
| Term | Mentions | Data required |
|---|
| Open interest | 163 | Futures open-interest series |
| TICK | 125 | Exchange-wide up/down tick counts |
| TRIN / Arms index | 49 | Advancing and declining issues and their volume |
| Advance–decline line | 26 | Market breadth |
| McClellan oscillator | 25 | Market breadth |
| New highs / new lows | 21 | Market breadth |
| Put/call ratio | 9 | Options volume |
None of these can be computed from an open-high-low-close-volume bar. Open interest ranks second among the book’s indicator terms because the book is written largely around futures.
Held: the Demand Index
Held
Published formulations differ materially and there is no independent reference implementation to test against, so the checks that back the other hand-written studies can’t be applied. A plausible-looking variant that can’t be verified is worse than a documented gap. It needs a chosen reference before it lands.
Chart constructions, and why there will be two renderers
| Construction | Figure captions | Lightweight Charts | Art’s Charts |
|---|
| Bar chart (OHLC) | 16 | Native | Not yet exposed |
| Candlestick | 2 | Native | Shipping |
| Line chart | 2 | Native | Shipping |
| Histogram (volume, MACD) | — | Native | Shipping |
| Logarithmic / semilog scale | 4 | Native | Not yet exposed |
| Point & figure | 14 | None | Planned · second renderer |
| Market profile | — | None | Planned · second renderer |
| Equivolume | 1 | None | Planned · second renderer |
Point & figure, market profile and equivolume share one property: time is not on the x-axis. Point & figure advances a column on each price reversal, market profile plots volume at each price, and equivolume makes bar width equal to volume. Lightweight Charts indexes every series by time, so these go to a second, declarative renderer, with the data transform done on the server.
Price structure: most of the book
| Feature | Mentions | In Art’s Charts today |
|---|
| Cycles / periodicity | 368 | Not computed |
| Support / resistance levels | 336 | Draw with the Level tool |
| Trendlines | 324 | Draw with Segment or Ray |
| Triangles | 174 | Draw with two segments |
| Gaps (breakaway, runaway, exhaustion) | 137 | Not computed |
| Flags, pennants, wedges, rectangles | 133 | Draw with segments |
| Channels | 120 | Draw with parallel segments or rays |
| Fibonacci retracements and fan lines | 83 | Fibonacci tool |
| Percentage retracements | 78 | Draw with the Level tool |
| Double / triple tops and bottoms | 70 | Not detected |
| Head and shoulders | 63 | Not detected; draw the neckline with Segment |
| Elliott wave | 42 | Not detected |
By weight, trendlines, levels, channels, retracements and chart patterns are the bulk of the book. They are geometry over the price series rather than indicator columns. You can draw nearly all of them by hand today with the six drawing tools; nothing detects them automatically. Pattern detection is a separate, larger body of work that would need its own design.